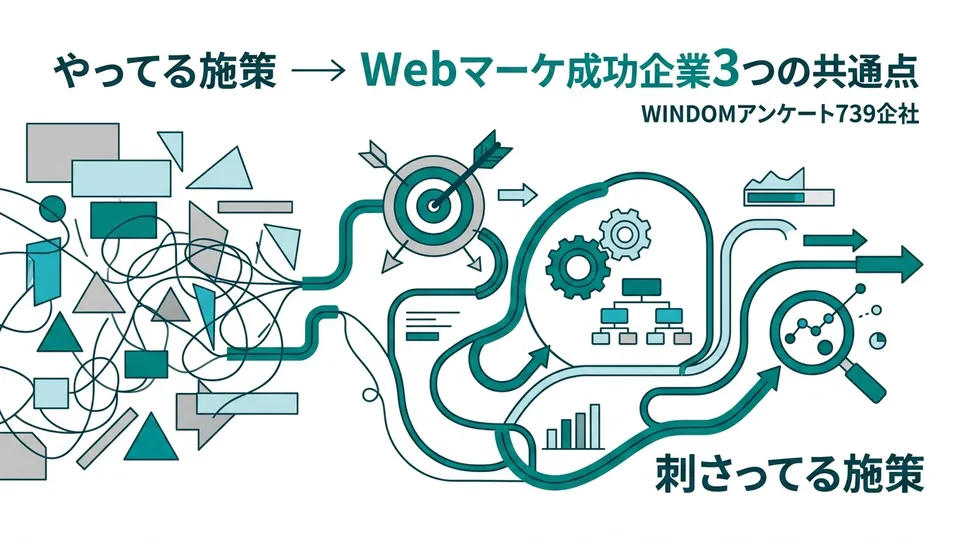
Running Tactics vs. Tactics That Work Are Two Different Things — WINDOM's 739-Company Survey Reveals 3 Traits of Winning Web Marketers
WINDOM surveyed 739 web marketing managers: the #1 success tactic and #2 failure tactic are identical. What splits winners from losers isn't what they do — it's who runs it and how. Includes a 3-axis self-audit.
What you'll learn in this article
- The key point to grasp before reading the full article
- How the issue changes practical decisions after reading
- Which follow-up article is worth opening next
[[IMG:hero]]
“Did those ads work out for you?” Ask that question in any room of marketers and the answers split right down the middle. Same social ads — one team calls it “best results we’ve ever seen,” another calls it “money into a hole.” Same search ads — one team says “became our main channel,” another says “we don’t even know when to quit.” Standard scene in web marketing.
WINDOM Co., Ltd. published survey results in January 2026 from 739 web marketing managers, surveyed in December 2025. The data put a number on that split. “Most successful tactic” — #1 is social advertising at 23.0%. That same social advertising also ranked #2 in “worst ROI” at 16.7%. Search advertising hit #2 in success (16.2%) and #1 in failure (18.5%) simultaneously.
Source: WINDOM Co., Ltd. “Web Marketing Reality Survey: 2025 vs 2026,” published January 26, 2026. N=739, survey date December 15, 2025, internet research method. URL: https://windom-kk.co.jp/news/978/
The reason the same tactic produces polar opposite results isn’t the tool’s capability. It’s “who is running it, and how.” The survey went far enough to put language on what “who and how” actually means. Three traits of successful companies, the single biggest failure factor, and 2026 budget allocation plans — I’ll pull the data directly from the primary source and lay it out in a form you can use to make actual decisions.
The Split in WINDOM’s 739 Companies — Who This Survey Is Actually About
First, the survey itself. 739 web marketing managers at companies. Top industries: manufacturers 19.6%, IT/telecom 16.2%, other 14.1%, real estate/construction 8.7%, retail/distribution 6.5%. Company size: 1–9 employees was the largest group at 30.6%, followed by 10–49 employees at 11.2%, and 100–299 at 10.6%. Customer segment: B2B 34.4%, B2C 25.2%, both 12.3%.
Source: WINDOM Co., Ltd. (same survey, N=739, December 15, 2025) URL: https://windom-kk.co.jp/news/978/
[[IMG:1]]
What this survey captures is the reality of small-to-mid-sized Japanese companies’ web marketing managers. Not enterprise-level SEO theory — it includes solo marketers and lean teams. The fact that 30% of respondents are from companies with 1–9 employees is worth keeping in mind as you read.
Now the core question: “What was your most successful tactic in the past 1–2 years?” The top four:
- Social advertising: 23.0%
- Search advertising (PPC): 16.2%
- Display / programmatic advertising: 14.1%
- Video advertising (YouTube, etc.): 11.0%
The same survey asked: “What was your worst-performing / most wasteful tactic in the past 1–2 years?”
- Search advertising (PPC): 18.5%
- Social advertising: 16.7%
- Display / programmatic advertising: 11.7%
- Video advertising: 10.4%
Source: Same survey. Success tactic N=191, failure tactic N=222. URL: https://windom-kk.co.jp/news/978/
[[IMG:2]]
The same tactic names appear on both lists. Social ads, search ads, display ads, video ads. This isn’t “some tactics succeed and others fail.” It’s “success and failure coexist within the same tactic.” Changing platforms won’t fix it. Pivoting your entire budget from search to social just recreates the same polarization inside social. Something else is deciding the outcome — and the survey went after it with two specific questions: the biggest failure factor, and the biggest success factor.
40% of Failures Came Down to “Message” — What You Spend On Matters Less Than What You Say
Companies that didn’t see the results they expected were asked to name the single biggest reason. Top factors:
| Rank | Factor | Share |
|---|---|---|
| 1 | Weak creative / messaging | 20.3% |
| 2 | Strategy mismatch (targeting / value prop / positioning) | 18.5% |
| 3 | KPI/evaluation design failure (KGI disconnect, wrong metrics) | 10.4% |
| 4 | Delivery and ops failure (bidding / delivery setup / frequency / exclusions) | 9.9% |
| 5 | Measurement / data failure (conversion gaps / attribution / tags) | 8.6% |
| 5 | Platform or tool was a poor fit for the business | 8.6% |
Source: WINDOM Co., Ltd. (same survey, N=222) URL: https://windom-kk.co.jp/news/978/
Add #1 and #2 together: 38.8% of failures were driven by “message and strategy.” Weak creative means the message doesn’t land. Strategy mismatch means there’s blur around who you’re selling to and what you’re offering. Neither of these gets fixed by switching platforms.
Ranks 3–5 are in the technical operations territory: KPI design failure (10.4%), delivery ops failure (9.9%), measurement failure (8.6%). Combined: 28.9%. The “message and strategy” category (38.8%) outweighs “technical operations” (28.9%).
That might feel counterintuitive. Web marketing discussions tend to front-load the delivery logic, attribution, and bidding strategy. But when the marketers themselves look back at their failures, the first answer is “the message was weak” or “the strategy was blurry.” That’s an honest retrospective.
When I work inside client teams, I see the same thing. Before touching the ad platform settings, I re-read the first line of the landing page. If I catch myself thinking “who is this copy making a promise to?” — the answer is right there. Fix the copy before adjusting the bids.
WINDOM’s survey states: “Whether it’s advertising or SEO, if you can’t provide quality content that resonates with your target audience, you’ll fail no matter how much budget you put in.” That’s the essence of content marketing, and 2026 won’t change it.
The 3 Traits That Define Winning Companies — 47.7% of Success Is “Expertise, Partnership, and Goals”
The same question was asked from the other direction: companies that saw results named their single biggest success factor. N=191 responses:
| Rank | Factor | Share |
|---|---|---|
| 1 | Built in-house expertise with a dedicated owner | 17.3% |
| 2 | Advanced together with a trusted partner | 15.2% |
| 3 | Set clear KGIs and KPIs (goals) from the start | 15.2% |
| 4 | Did deep analysis of target audience needs | 14.7% |
| 5 | Had strong creative / messaging | 13.1% |
| 6 | Kept iterating without fear of failure | 7.3% |
| 7 | Timing and market environment were favorable | 6.3% |
| 7 | Had excellent delivery setup and operations | 6.3% |
Source: WINDOM Co., Ltd. (same survey, N=191) URL: https://windom-kk.co.jp/news/978/
[[IMG:3]]
Add the top three: 47.7%. “Dedicated in-house owner building expertise” + “trusted partner working side by side” + “clear goal design.” Nearly half of all success is explained by these three.
The interesting tension is between #1 and #2. “In-house dedicated owner” (leaning insourced) and “advancing with a trusted partner” (external) look like opposites. But both ranked at the top.
The pattern isn’t “full insourcing” or “full outsourcing.” It’s building in-house knowledge while collaborating with a partner. The survey reads it the same way. In practice, the companies that work well hold regular reviews — even just a few hours per month — between the internal owner and the partner. Contrast that with “we’ll just hand it over entirely” — which leaves nothing inside the company and makes next-year decisions impossible. I’ve seen it fail that way more than once.
The tie at #3 between “clear KGI/KPI setting” (15.2%) and #2 (15.2%) also matters. It mirrors failure factor #3: “KPI/evaluation design failure” (10.4%). Companies with defined goals succeed. Companies without them fail. Written out it sounds obvious, but in practice, fewer companies than you’d expect have KGIs and KPIs that actually connect.
One more data point to complete the picture. The top outcomes achieved by successful companies: “increased new lead acquisition” (41.4%), “improved awareness/favorability” (36.1%), “reduced costs” (31.9%), “direct sales/profit improvement” (30.4%). N=191.
Source: WINDOM Co., Ltd. (same survey, N=191) URL: https://windom-kk.co.jp/news/978/
The #2 spot — “improved awareness/favorability” at 36.1% — signals something about how winning companies are running their marketing. They’re not chasing direct revenue at the exclusion of everything else. They’re simultaneously building brand assets that pay out over time. Having leads, brand, and cost reduction all in the top 3 is quiet evidence of strategic intentionality.
Self-Audit Checklist — 3 Axes to Inventory Where You Actually Stand
I’m converting the survey data into a tool. The “3 traits of winning companies” become a 3-axis scoring sheet.
[[IMG:4]]
Axis 1: Dedicated Ownership (time allocation and expertise accumulation)
- 0 points: No dedicated owner. Someone handles it part-time.
- 1 point: A part-time owner exists but spends less than 20% of their time on it.
- 2 points: A dedicated owner exists, or a team member has 10+ committed hours per week.
- 3 points: Multiple dedicated people, and knowledge is actively shared among them.
A team running “part-time, a few hours a month” keeps all expertise inside one person’s head. Every time that person changes, you reset to zero. WINDOM’s “built in-house expertise” means escaping exactly that pattern.
Axis 2: Partner Quality (are you able to have a real conversation?)
- 0 points: No partner. Or you can’t describe what they’re doing.
- 1 point: You have an agency, but review is monthly report only.
- 2 points: You meet at least monthly to review what’s working and what isn’t.
- 3 points: Your partner brings your own data and challenges strategy-level thinking.
Low scores here put you close to the failure factor “black-boxing / full handoff to agency” (5.9%). “Under contract” and “having real strategic dialogue” are completely different.
Axis 3: KGI/KPI Clarity (who decides, when, based on what?)
- 0 points: KGIs/KPIs aren’t clearly defined internally.
- 1 point: Numbers exist but there’s been no review meeting in over 3 months.
- 2 points: You have a monthly session to check KGIs/KPIs.
- 3 points: You’ve actually used the numbers to make a continue/stop call on a tactic.
WINDOM found “KPI/evaluation design failure” as failure factor #3 (10.4%). “No numbers” and “numbers exist but no one looks at them” both score low here.
Total: 9 points possible. Treat 6 or below as “needs improvement.” The infrastructure for the top-3 success factors (combined 47.7%) isn’t in place yet. At 7–9, you’re spending time on “sharpening” rather than fixing foundations.
Run this audit in the first five minutes of a monthly team meeting. Have the manager and the marketing owner score independently, then compare. The gaps are usually illuminating — the manager who thinks “we have a dedicated owner” and the team member who thinks “this is still a side task” both get visible at once.
2026 Budget Plans: “Back to Basics” — What 44% Saying “No Budget Increases” Really Signals
Final section: 2026 budget allocations. WINDOM asked: “Compared to 2025, which tactics do you plan to increase budget for in 2026?” N=739:
| Rank | Tactic | Share |
|---|---|---|
| 1 | Social advertising | 10.0% |
| 2 | Search advertising (PPC) | 8.1% |
| 3 | Display / programmatic | 7.6% |
| 4 | Video advertising | 5.3% |
| 5 | SEO | 3.0% |
| — | AI search optimization (SGE/AIO/AI SEO, etc.) | 1.6% |
| — | No plans to increase budget | 44.0% |
Source: WINDOM Co., Ltd. (same survey, N=739) URL: https://windom-kk.co.jp/news/978/
[[IMG:5]]
The top tactics to increase budget are social ads, search ads, display ads, video ads, and SEO — web advertising’s established playbook. AI search optimization is at 1.6%, still firmly in “watching and waiting” territory. The intent is clearly to sharpen results from reliable channels, not rush into “AI-first” territory.
The number that jumped out most: 44.0% said “no plans to increase budget.”
More than 4 in 10 companies are not planning to grow their marketing spend next year. My read isn’t “the economy is bad.” It’s “fix the operations before adding budget.” Go back to the #1 and #2 failure factors: weak message, strategy mismatch. Pouring more budget into broken messaging just scales the failure. A lot of marketing managers have felt that causality firsthand — and 44.0% is the result.
AI search optimization at 1.6% might look low given how rapidly generative AI search traffic is growing. Multiple surveys have documented the acceleration. The frameworks — GEO, AEO, LLMO — have been covered in earlier articles (Bundling GEO, AEO, and LLMO into One Strategy, Anthropic Just Handed 15 AI Agents to Small Businesses). But on-the-ground budget hasn’t moved yet.
Two strategic read-outs from this.
Option 1: Wait. Before moving on AI search optimization, sharpen existing web advertising and SEO operations. Get the 3-axis score up first. Don’t rush into the territory 98.4% are still ignoring.
Option 2: Move early. Get a light position in the 1.6% territory now. Be on the side that people will wish they’d joined a year from now. Earlier articles on the 7 key AI×SEO statistics and why late-movers in certain industries have the GEO advantage were written from this second position.
Which option is right depends on your 3-axis score. Under 6: wait. Fix the inside first — that’s higher priority than AI optimization. 7 and above: moving early is on the table.
This Week’s Move — 3 Actions to Strengthen the “Message” Layer
Don’t close out on just reading the numbers. Based on WINDOM’s direction, here are 3 actions you can start this week. All of them target the top failure factors (message layer, 38.8%). Each takes 30 to 60 minutes to begin.
Action 1: Rewrite 10 active ad copies as if talking to one specific person
Pull 10 of your current ad creatives or landing page headlines. Rewrite each one as if speaking to a single specific customer — someone real, like an existing client named Tanaka-san. Strip out every abstraction: “industry-leading,” “cutting-edge,” “leave it to us.”
If stripping those words leaves nothing behind, the ad probably wasn’t saying anything to begin with. This is the most direct fix for failure factor #1 (weak creative/messaging, 20.3%).
Action 2: Lock in 10 hours per month for a dedicated owner via internal negotiation
If your Axis 1 score is 0 or 1, secure at minimum 10 hours per month of dedicated time starting next week. If you need to negotiate for it, come with a proposal for what to stop doing. For example: automate the monthly report (saves ~4 hours), redirect that time to review meetings and strategy. Ten hours is roughly 2.5 hours per week — achievable in most organizations without a full headcount.
WINDOM’s “in-house expertise through a dedicated owner” (17.3%) starts here and nowhere else.
Action 3: Redefine your KGI/KPIs with 3 columns — who, when, with what number
Open a spreadsheet and list your current KGIs and KPIs. Add three columns next to each: “who decides,” “when,” and “based on what number.” Any blank cells are operational blind spots.
WINDOM’s success factor #3 is “clear KGI/KPI setting” (15.2%). Failure factor #3 is “KPI/evaluation design failure” (10.4%). Same topic, opposite outcomes. Filling in all three columns changes your next month’s decision speed.
Start all three on Monday morning if you can. Together they take under two hours. They put your hands directly on the message layer (failure factor, 38.8%) and the operational infrastructure layer (success factor, 47.7%) simultaneously.
Summary: “Who Runs It and How” Is the Dividing Line
WINDOM’s survey of 739 companies established one clear fact: wins and losses in web marketing are decided by operating structure, not tactic selection.
- The same social ads appear in success #1 (23.0%) and failure #2 (16.7%). Tools don’t determine outcomes — operations do.
- The biggest failure factor is “message and strategy” (creative weakness 20.3% + strategy mismatch 18.5% = 38.8%)
- The top 3 success factors (in-house expertise 17.3% + partner collaboration 15.2% + goal design 15.2% = 47.7%) define the infrastructure of winning companies
- 44.0% of respondents are not planning to increase 2026 budgets. AI search optimization is at 1.6% — still firmly in “watching” mode
- The move: “3 actions to strengthen the message layer” + “3-axis self-audit”
I don’t believe in “AI will take your job” or “you need the newest tool starting tomorrow.” What WINDOM’s survey showed is more unglamorous — and more fundamental.
“Who is running this, in what structure, saying what.” That’s what decides web marketing results in 2026, just as it has before. Before chasing the newest tool or the latest AI trend, spend this week rewriting 10 ad copies. Once your 3-axis score breaks 7, there’s still plenty of time to think about AI optimization.
The data is in. The only question is where you start this week.
Sources
- WINDOM Co., Ltd. “Web Marketing Reality Survey: 2025 vs 2026 — Successful and Failed Tactics, and Their Causes,” published January 26, 2026. N=739 (corporate web marketing managers), survey method: internet research, survey date: December 15, 2025. URL: https://windom-kk.co.jp/news/978/
Related articles

AIを使いこなせない方は、この先どんどん差がつきます。僕はAIエージェントを毎日動かして、壊して、直して、また動かしてます。そういう泥臭い実践の記録をここに書いてます。理論は他の方にお任せしました。僕は動くものを作ります。朝5時に起きてウォーキングしてからコードを書くのがルーティンです。