"AI Coding Sounds Good, But Show Me the Numbers." An ROI Reporting Method with 5 Metrics Using the GA'd GitHub Copilot Metrics
"Development got faster after we brought in Copilot, right?"
What you'll learn in this article
- The key point to grasp before reading the full article
- How the issue changes the way developers should work next
- Which follow-up article is worth opening next
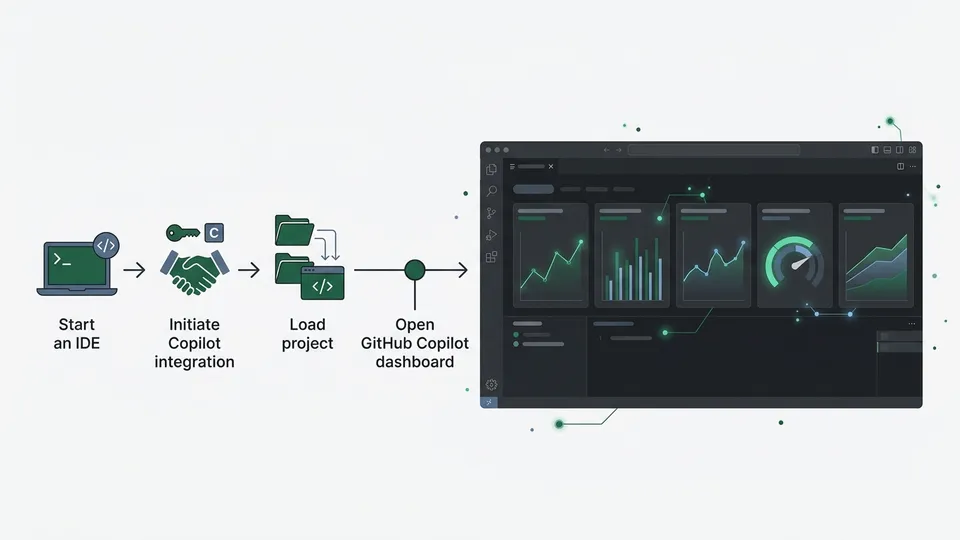
“It Feels Faster With AI” Doesn’t Cut It Anymore
“Development got faster after we brought in Copilot, right?”
Conversations like that started popping up more often in our team Slack. I felt it too. Autocomplete works. Test generation helps.
But here’s what my boss came back with:
“Not ‘feels.’ Can you show me in numbers?”
Honestly, I had nothing to say. As someone with a customer success background, presenting adoption results in numbers is basics 101. And yet I’d stopped at “kinda feels faster.”
A tool that changes that situation has arrived. It’s GitHub Copilot metrics, which went GA (general availability) in February 2026.
The old API will be retired on April 2. The migration countdown has already begun.
In this article, I’ll break down five metrics into a “report format for your boss.” I’ll also confront the contradictory data of “55% faster” vs “19% slower.”
I’ll share the gotchas upfront too. I want you to skip the time I spent on them.
Estimated reading time: about 12 minutes. You can understand it without reading the code.
What’s Happening on April 2: The Legacy API Retirement Breakdown
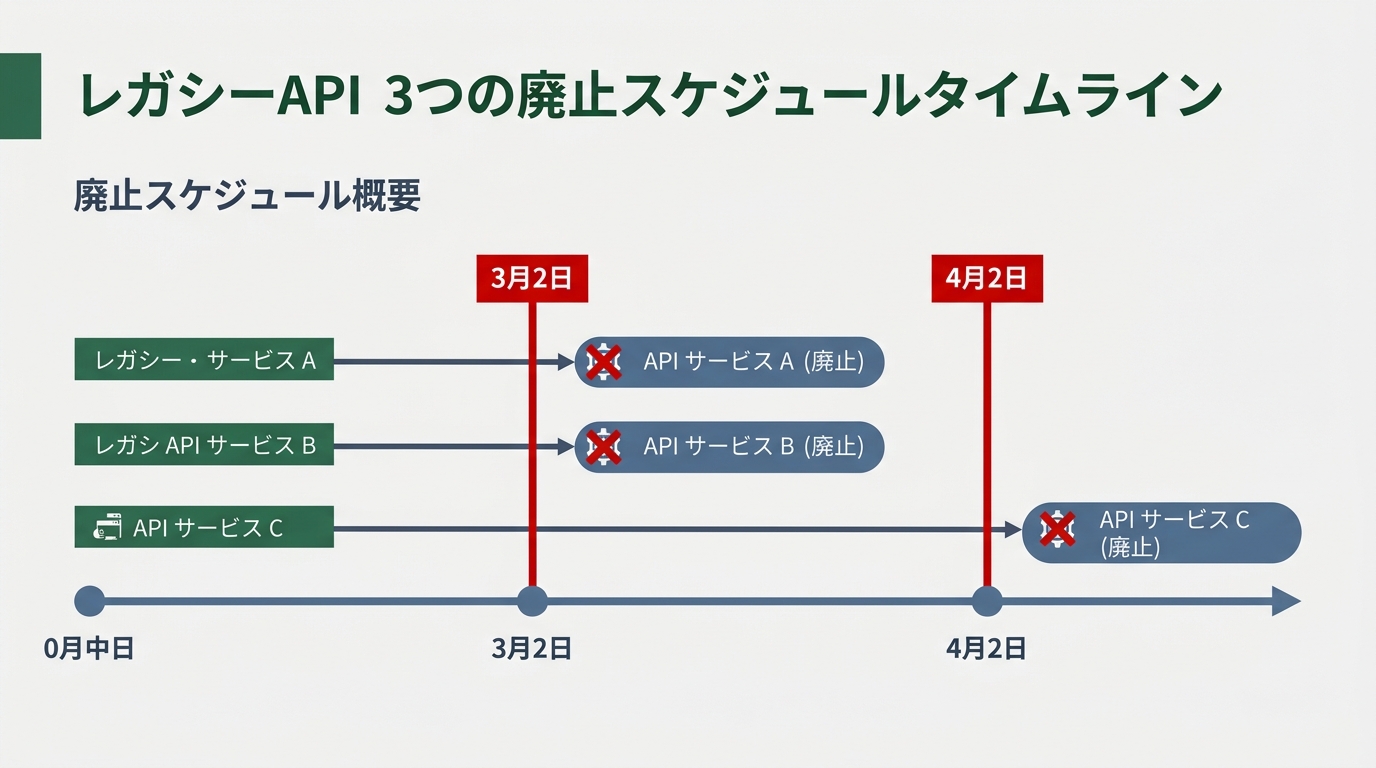
Let me lay out the situation. On January 29, 2026, GitHub announced the deprecation of three legacy APIs.
- Copilot Metrics API: Aggregated usage stats. Primarily data on IDE operations
- User-level Feature Engagement Metrics API: Per-user feature usage. Already retired ahead of schedule on March 2
- Direct Data Access API: Code completion event logs. Already retired on March 2
Two of the three are already unavailable. The remaining one disappears on April 2.
If you’re thinking “this might not concern us,” please check.
Microsoft publishes an open-source dashboard (OSS = open source, freely available to anyone). It’s copilot-metrics-dashboard.
Many teams fork this for internal use. Since it depends on the legacy APIs, the graphs will stop updating on April 2.
The migration target is the new Copilot usage metrics API. The one that went GA on February 27.
The biggest difference from the old API is the ability to track “agent usage.” Agent Mode usage can now be measured. That’s a perspective the old API didn’t have.
Here’s the gotcha upfront. The data structures differ between the old and new APIs. The endpoint URLs are also different.
/copilot/usage is the old one, /copilot/metrics is the new one.
Simply swapping URLs won’t work in some cases.
Check the official documentation for migration steps.
Translating 5 Metrics Into “Something Your Boss Can See”
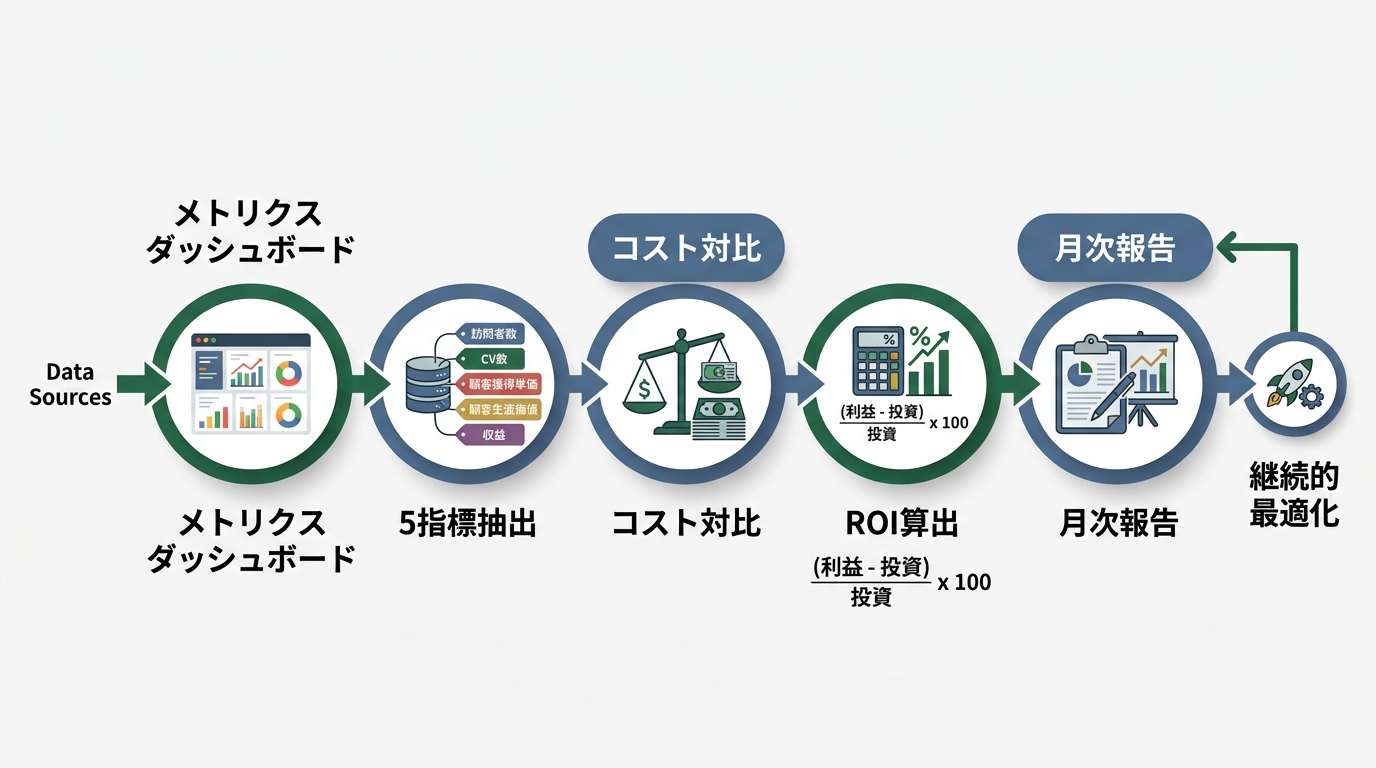
The new dashboard provides numbers across 5 categories. I translated each into “what to tell your boss.”
Metric 1: Adoption (Penetration Rate)
Of the license holders, how many are actually using it. You can drill down to DAU (daily active rate).
Translation for your boss: “Of our 50 licenses, 38 people use it daily. That’s a 76% utilization rate.”
The average utilization rate for SaaS (subscription-based cloud services) is about 50%. If you’re significantly exceeding that, you can argue you’ve cleared the ROI threshold.
According to Accenture’s case study, 67% of developers who adopted it use it 5+ days a week. It’s a tool where “bought but unused” rarely happens.
Metric 2: Code Generation
The number of lines AI suggested, accepted, and committed. You can track this for completion, Chat, and Agent separately.
Translation for your boss: “30% of code suggested by Copilot was adopted. It’s contributing especially in test generation.”
According to GitHub’s public data, about 46% of developer code goes through Copilot. Up from 27% in 2022. For Java, it reaches 61%.
Metric 3: Agent Usage
This is the headline of the new API. It tracks the usage ratio between Chat and Agent Mode. Data that didn’t exist in the old API.
Translation for your boss: “Agent Mode usage has tripled since last month. As the next phase, I propose we develop guidelines.”
Metric 4: PR Throughput
The number of PRs (pull requests = proposed code changes) created, median time to merge, and review utilization rate. You can compare Copilot-assisted PRs against the rest.
Translation for your boss: “Copilot-assisted PRs merge in 4.2 hours on average. Non-assisted PRs take 6.8 hours.”
The 2.6-hour difference × team size becomes monthly hours saved. The Accenture case recorded +8.69% in PRs and +11% in merge rate. Build success rate was +84%.

Metric 5: Acceptance Rate
What percentage of Copilot’s completion suggestions were accepted. The industry average is about 30%.
Translation for your boss: “Teams with low acceptance rates have room to improve their settings. Teams that are too high may not be reviewing enough.”
This metric isn’t a case of “higher is better.” If it’s abnormally high, developers may be accepting AI suggestions uncritically.
The GitClear report is worth a look. It reports an increase in churn rate (how quickly code gets rewritten) for AI-assisted code. The balance with quality matters.
”55% Faster” vs “19% Slower.” Which Is True?
Let’s tackle the unavoidable topic. There’s a famous contradiction in AI coding productivity data.
The vendor side’s claim: In GitHub/Microsoft experiments, task completion got 55.8% faster.
Independent research results: AI safety research organization METR published an RCT (randomized controlled trial) in July 2025. Experienced developers’ productivity dropped 19%.
The opposite result. Which should you believe?
The answer is “both are correct. But the conditions are different.”
The vendor experiment measured isolated tasks. Writing a single function, generating a test. AI completion works powerfully in such limited tasks.
METR’s experiment was different. The subjects were 16 experienced OSS developers. They tackled 246 real tasks in repositories they’d maintained for years.
Bug fixes, feature additions, refactoring. For developers who know the codebase intimately, the cost of verifying AI output exceeded the time savings.

There’s an even more interesting data point. Developers in the METR experiment thought “I got 20% faster.” When in reality they were 19% slower.
A gap between perception and measurement. It exists.
This is why “it feels faster” doesn’t make a report. This is the rationale for measuring with the metrics API.
The ROI Reporting Template I Built
Now for the practical part. Here’s how to turn metrics data into a form executives can understand.
# Copilot ROI Monthly Report Template

## 1. Cost
# Business seat $19/month × team size
# Enterprise seat $39/month × team size
monthly_cost = unit_price * team_size

## 2. Time Savings (calculated from PR Throughput)
# Avg merge time for Copilot-assisted PRs vs non-assisted PRs
# Difference × monthly PR count = monthly hours saved
time_saved_hours = (non_copilot_merge_hrs - copilot_merge_hrs) * monthly_pr_count

## 3. Labor Cost Conversion
# Hours saved × engineer hourly rate
value_generated = time_saved_hours * hourly_rate

## 4. ROI
# (labor cost value - license cost) / license cost × 100
roi_percent = (value_generated - monthly_cost) / monthly_cost * 100
The point is one thing. The calculation uses only numbers you can pull directly from the dashboard. No subjective values enter the equation.
If your boss asks “what’s the basis?”, just show them a screenshot.
Coming from CS, I get it. The most hated thing in internal proposals is a report with “qualitative evaluation only.”
“Developers are satisfied” doesn’t land with decision-makers. “40 hours saved monthly, equivalent to about ¥4.8M annually” gets the proposal approved.
The Accenture case recorded a +84% build success rate. That’s a number meaning “fewer reworks,” which can be included as an indirect ROI contributor.
The Duolingo case is also worth referencing. Speed for developers unfamiliar with the code improved by +25%. Review time was cut by 67% at the median (9.6 days → 2.4 days).
These are numbers that can be counted as onboarding cost reduction.
3 Cautions for Turning This Into a Form Executives Can Receive
Once you can get the numbers, it’s exciting. But when packaging it into a report, there are 3 pitfalls.
Caution 1: Measure the baseline first
Without numbers from before Copilot was introduced, you can’t compare. If you want to say “we got faster,” you need “before, it was like this.”
If it’s already been rolled out to everyone, one option is to temporarily turn it off for a subset of teams. But expect pushback from developers.
Caution 2: Don’t judge by acceptance rate alone
A 30% acceptance rate doesn’t mean “70% is waste.” The act of looking at suggestions and judging them functions as a kind of code review.
If you judge “inefficient” by numbers alone, you’ll miss the essence.
Caution 3: Factor in security costs
AI-generated code carries different vulnerability risk patterns than human-written code.
If you calculate ROI using only the metrics numbers, you’ll overlook the added cost of security reviews.
There are reports that without governance, issue counts increased about 1.7x.
It’s safer to understand that “the faster you get, the more reviews you’ll need.”
Summary: The “Tools to Speak in Numbers” Are All Here
With the GA of Copilot metrics, measuring AI coding’s impact has entered a new phase. A shift from “people who can do it, do it” to “running it as a system.”
The legacy API retirement on April 2 is both a migration task and a moment to reconsider. “Were you actually measuring in the first place?”
Looking back, when I first touched Copilot, I stopped at “fast, amazing.” I wrote countless adoption impact reports in my CS days, yet when it became my own tool, I got soft.
The habit of speaking in numbers disappears unless you consciously protect it.
Let me organize today’s 5 metrics.
- Adoption: License utilization. If it’s not being used, take action
- Code Generation: AI’s contribution volume. Analyze by language and task
- Agent Usage: Degree of migration from Chat to Agent
- PR Throughput: The metric that translates most directly to ROI
- Acceptance Rate: Quality of suggestions. Be cautious whether too high or too low
Swallowing “55% faster” whole, or giving up at “19% slower” — neither is right. Measure your own team’s numbers, and calculate your own ROI.
The tools are all here. Now it’s just a question of whether you’ll do it.
Sources
- Copilot metrics is now generally available - GitHub Changelog
- Closing down notice of legacy Copilot metrics APIs - GitHub Changelog
- REST API endpoints for Copilot metrics - GitHub Docs
- Data available in Copilot usage metrics - GitHub Docs
- Research: Quantifying GitHub Copilot’s Impact with Accenture - GitHub Blog
- METR AI Developer Productivity Study
- METR study on arXiv

正直、一度エンジニアは諦めました。新卒で入った開発会社でバケモノみたいに優秀な人たちに囲まれて、「あ、私はこっち側じゃないな」って悟ったんです。その後はカスタマーサクセスに転向して10年。でもCursorとClaude Codeに出会って、全部変わりました。完璧なコードじゃなくていい。自分の仕事を自分で楽にするコードが書ければ、それでいいんですよ。週末はサウナで整いながら次に作るツールのこと考えてます。